Africa Digital transformation 2020-2030 - short term, Long-term implementation Scenarios, an alternative view
Executive Summary
Sam Atuhamya is a young, energetic casual laborer on a small four acre banana
plantation just 25km outside of Kampala, the capital city of Uganda. He earns
about USD40 a month. Sam has a small 2G phone he uses to communicate regularly
with his family, a wife and 2 school going children, about 400km away in the
south west of Uganda. They have two lactating cows and regularly earn a small
monthly income, about USD30 to supplement Sam's’ monthly income.
The family therefore
earns about USD70 monthly part of which is used to pay school fees for the
children.
Sam has no
electricity at his house, even though the grid is about 4km away from his
workstation. So Sam has to carry his phone, always walking past the overhead
electricity lines to a nearby trading centre to charge. It is a similar
situation for the Wife, with the Grid several Kilometers away.
Sam’s household
represents the broad spectrum of families in Africa, from Madagascar, Nigeria,
South Sudan or Kenya, low income generating, largely living in rural areas with
scanty, if any, access to utilities like electricity, water and
telecommunications.
It represents the
focus of the broadband and digital transformation agenda of the World Bank Moonshot for Africa Report 2019,
Dead spots or areas outside of broadband coverage – near towns or inland in
ultra rural areas, with a population whose revenue potential isn’t attractive
to established telecom operators to fast track investment.
Objective
The key objective of this paper is to look at ways of speeding up
implementation of broadband roll-outs with the forecast investment expenditure
to achieve the World Bank 2021 and 2030 digital transformation milestones.
Some Definitions
To help us understand the end game towards
World Banks’ digitalization agenda, we extra some definitions for context in
the table below;
|
|
|
|
Broadband |
Defined as a download
rate of 3mbps(2021 target) and 10mbps(2030 target) over a technology neutral
connection |
|
Unserved, Unconnected Areas |
Areas with no network coverage, with no incentive for
traditional telco investment, or areas with traditional 2G and require 3G /4G
or equivalent technology upgrade to support broadband connections |
|
Budget (2021 target) |
USD9bn investment
forecast to Double broadband connections from 2016 numbers, and 220m new
users online |
|
Budget (2030 target) |
USD100bn investment
forecast to connect 1.1billion users online, with 250,000KM of fibre &
400,000 4G/5G and other technology
Base stations |
|
|
|
A snapshot of Africa Telco Roll-outs
Telecom
companies will always follow the money. This means that their business plans,
their investments will be tied to areas with proven, demonstrable economic
activity and sizeable population density. You will therefore always find fiber
or transmission roll-outs following highways, site roll-outs targeting areas
with sizeable population numbers fitting into their Average Revenue per user
(ARPU) agenda.
It’s
therefore inevitable that some areas inland are locked out of Broadband network
coverage. For digitization to happen in such areas, in line with WB 2030
agenda, Development Partners, country regulatory bodies, Integration Partners
must work together to find innovative, sustainable and cost-effective broadband
solutions to fill this Gap.
Community Set up
Communities in Africa
will vary in size, but in order to address the Broadband gap, it is important
to understand their various set-ups to provide information on population
density and possible economic activities in those areas.
In Uganda for example,
you have the smallest administrative unit, the Local Council 1(LC1) with a
population of about 250 -1000 People
In Madagascar you
have the Communes made up of several Fokontany as the smallest administrative
unit, with varying population density based on proximity to the Ocean and/or
inland near small towns/communities.
For purposes of this
paper we will assume a rural population of anywhere between 50-300 people,
under the knowledge that Telco players would in any case have economic
motivation to invest in areas with populations exceeding these numbers.
The Electricity Conundrum
Most
rural communities in Africa lack basic utilities like water and electricity. In
order for the Broadband value chain to be complete, we must address the issue
of electricity. This is vital in charging phones and powering base Stations,
microwave or satellite links that make up the broadband network.
The cost
of extending grid distribution lines is prohibitive (cost
per km anywhere between 20-30,000USD in Uganda)
and in fact in some cases the rural area just provides a transit/Wayleaves
access route to the next town, without necessarily being served.
In places
like the South of Madagascar, not only is the road network, crucial in speeding
up broadband installations, especially impassable in Rainy seasons, you will
find that outside of Fort Dauphan (Tolagnaro) towards Amboasary, Ambovombe,
Tsihombe, and Beloha, the sign of electricity is only found within the
community town, being run on diesel generators with no sign of Gridlines in
between, even though along the route are several small rural communities.
Indeed,
2018 data from one operator there shows just over 50% of sites running on diesel generators, which means high
Operational expenditure, translating into higher Broadband prices.
Solution?
We can circumvent this challenge by taking
advantage of our natural energy endowment by harnessing the power of Solar
Energy.
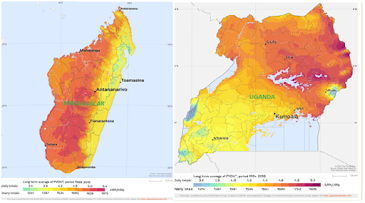
Solar Photovoltaic (PV) intensity or
irradiation in specifically Sub-Saharan Africa (SSA) is such that there are
enough hours of sunshine, an average of 4-5Hours, to generate enough energy to
power broadband sites and community internet access centers. See sample figure
below;
Luckily, the cost of solar equipment today is also
cheaper, thanks to regulatory and Government initiatives like some tax
exemptions e.g. here in Uganda.
Therefore, in understanding precise power
requirements of broadband base stations, we can size, cost and implement an
effective and practical solar power solution that delivers affordable, quality
broadband.
So whats the average power requirement
for a remote rural site?
The
assumption is that we want to cover remote rural areas, off-grid, sparsely
populated and out of reach for traditional telecoms.
We must
dimension a solution that balances Cost, Coverage & quality requirements,
meets today’s expectation (3mbps baseline) but also provide a smooth transition
into future technology upgrades. The latter is achieved by using Software
Defined Radio (SDR) Units that can be software upgradable without change of
Hardware.
The table below shows power consumption by BTSes from some leading equipment vendors
|
Vendor |
Technology |
Configuration |
Typical Power Consumption(W) |
Microwave(W) |
Site Load(W) |
|
Nokia(flexiModule BTS) |
GSM +WCDMA |
S6+U_4 |
790 |
100 |
890 |
|
|
|
|
|
|
|
|
ZTE(ZXSDR BS8906) |
GSM +WCDMA |
G_S4+U_S1, DC |
465 |
100 |
565 |
|
|
GSM +WCDMA |
G_S444+U_S111 |
815 |
100 |
915 |
Table 1 shows the average power consumption for a loaded BTS, including microwave or VSAT transmission equipment.
For the remote
rural site, consumption will be way much lower than in the above table because
the configuration will be smaller say 1 transceiver
unit (TRX) and 1 UMTS carrier. For this paper, we will assume a realistic
maximum power Consumption of 400W. With the Solution set up and Maintenance
free, this adds to reducing the end cost of broadband bundles for the users,
ultimately leading to more connections.
Deployment Scenarios
Connectivity
of Base stations in rural areas to the super information highways of the
Internet can only be possible with a baseline of a solid transmission
backbone. The ultimate end goal is
therefore to have fibre connectivity as near to remote rural areas as possible.
However for the case of Sub-Saharan Africa, the nearest point of Presence for
fibre is realistically far off, in some cases more than the 25km mentioned in
the moonlight light report. Therefore it’s important to devise alternative means
of backhauling the rural site traffic. Most deployment scenarios will follow a
monolithic and/or distributed architecture framework as shown below;

The Ideal Power System
A standalone
solar system, with a 24Hour autonomy and as seen in Figure 2 below completes
the site configuration, with the number/quantity of panels, battery and charge
controllers dependent solely on site load.

Rural Tower Design and Site Lay-out
Normal
telecom towers take a month or more to erect and commission depending on
factors such as weight/ tower loading, civil works completion, route/road
access etc. For remote rural sites, It is necessary to dimension a tower that’s
low cost, can be installed and commissioned within a day or two to facilitate fast
turnaround times for broadband coverage and online access by rural population.
In General, an ideal tower for remote rural broadband coverage should be anywhere between 10-20m, closer to the population, with antennae that meet minimum electromagnetic radiation safety standards as shown in the Figure below;

Security
for the remote rural sites to avoid vandalism
and theft can be handled at a community level, which adds to reduction in
overhead costs.
2G, 3G,
4G access technologies assume a lion of sight environment to provide adequate
broadband coverage. Alongside this is the need to limit interference to
acceptable levels. Therefore cell radius or coverage area will in most cases be
limited to 100’s of meters to a few kilometers. With this reality in mind, the
number of base stations required will be higher which increases the cumulative
cost of deployment. This hence presents a case for looking at alternative
technology deployments to achieve the same end goal.
TV White Space Technology (TVWS)
This is a
new technology that takes advantage of idle spectrum, the guard bands, within
the UHF and VHF bands for Television broadcast to deliver broadband
connectivity.
It works very well in non-line of sight
conditions and its coverage area can therefore stretch to up to 10km, with
distances of up to 50km in Line of sight conditions and therefore fewer BTSes. The
Gen3 Rural Connect Base Station from
Carlson Wireless provides these and other features; with plug and play installation
times meaning broadband can be delivered to schools, health centres, in remote
areas quicker.

Trials of this technology to deliver broadband
have been conducted by Carlson Wireless & Neul, with support by ICASA successfully in Cape Town South Africa, with Download
speeds up to 12Mbps and upload speeds of up to 4Mbps over a 6month trial period
attained.
It’s
therefore prudent that for the broadband agenda 2030 to be achieved TVWS must
be considered for point to point and point to multipoint roll-out in various
communities.
Wi-Fi
This is
another alternative technology, based on the IEEE802.11 (xx) Standards that can
provide broadband in the unlicensed 2.4GHz and 5GHz bands with coverage radius
upwards of a kilometer. Advancements in the IEEE802.11xx technology standards
mean carrier grade Wi-Fi can provide stable connections for some rural
deployments.
A Quantitative analysis of forecast
network deployments and what it means for Africa
The World Bank moonlight report
forecasts deployment of four hundred thousand (400,000) 4G and 5G base stations
as well as two hundred and Fifty thousand (250000) Kilometers of Fiber
Based on
the above figures, a linear analysis of what this means in the context of
Africa is shown in the table below, where we have assumed a ratio of 5%:95%
investment allocation over the 11 year cycle (2019-2030) respectively between
Northern Africa and Sub-Saharan Africa. This assumption is based on the facts
below;
- a) Northern Africa broadband coverage is
higher compared to that in Sub-Saharan Africa, with only about 2% out of
broadband network coverage according to the moonlight report
- b) There are fewer countries, only 5, in northern Africa as compared to Sub-Saharan Africa
|
Total Forecast Investment |
||
|
Fibre(KM) |
250000 |
|
|
Base stations |
400000 |
|
|
Region |
Northern Africa |
SubSaharan Africa |
|
Countries |
5 |
49 |
|
% Investment allocations |
5% |
95% |
|
Categorized Investment breakdown(Regions) |
||
|
Total Fibre(Km) |
12500 |
237500 |
|
Total Base station |
20000 |
380000 |
|
Per Country Deployment Forecast |
||
|
Fibre(Km) |
2500 |
4847 |
|
Base stations |
4000 |
7755 |
|
Annual Deployment Forecast(Per Country) |
||
|
Fibre(Km) |
227 |
441 |
|
Base stations(BST) |
364 |
705 |
Table 2
shows that to achieve the 2021 and 2030 targets,
·
Each
country in Northern Africa needs to deploy, consistently, 227KM of Fiber
annually (19KM monthly),and 364 BST annually( 30 BST monthly)
·
Each
country in Sub-Saharan Africa needs to deploy, consistently, 441KM of Fiber
annually(about 37KM monthly), and 705 BST annually or( about 59 BST monthly)
From this
information we can deduce that applying Country specific coefficients will
determine how many more (or less) allocations in terms of length of fiber or
number and category of base stations per country per Year. Also at a country
level, it is necessary to use a targeted approach in expanding broadband by
looking to cover first areas with significant economic potential.
This
linear analysis clearly shows that the length of fiber seems small compared to
the number of users forecast to be online by 2030. To achieve true broadband,
we argue that there needs to be more investment in Fibre / transmission network
footprint down to community level.
But how long does it take to do a
Kilometer of Fiber?
Execution
timelines for deploying fiber underground, overhead or in a mixed configuration
is a critical determinant in achieving the 2021/2030 broadband Coverage agenda
as it provides the baseline for interconnecting base stations to the internet
to facilitate broadband access. The major activities for underground fiber
deployment, as an example are below;
|
No. |
Field Teams |
Team Composition |
Fibre Activities |
Day 1 |
Day 2 |
Day 3 |
|
1 |
Team 1 |
100 |
Route Trenching |
|
|
|
|
2 |
Team 1 |
Duct Installation |
|
|
|
|
|
3 |
Team 2 |
20 |
Backfilling & Reinstatements |
|
|
|
|
4 |
Team 2 |
Compaction |
|
|
|
|
|
5 |
Team 3 |
10 |
Manhole Installation |
|
|
|
|
6 |
Team 4 |
10 |
Fibre Hauling in Duct |
|
|
|
|
7 |
Team 5 |
Fibre Splicing & Test |
|
|
|
An aggressive activity schedule to deploy 1KM of
fiber includes mainly 7 activities each following the other, with an average
daily output of 10m per rigour in the
trenching team. We also assume that prior activities like pre-casting of Manholes, procurement of
fiber & ducts happened previously. Further,
that there are fewer reinstatements due to tarmac
demolition as the physical routes are towards rural areas and mainly earth/loam
soil.
We can conclude from the above that,
- ·
A minimum of three (3) days and 140 rigors
in the field are required to complete a 1KM fibre stretch end to end.
- ·
Multiple teams and multiple
installers for each activity are needed to fast track implementation and
realize the 2021/2030 broadband agenda by doing most of the activities in
parallel
- ·
Technology must be used to fast
track deployments
Synergies with other Public Infrastructure projects, and the budget saving
Governments normally engage in big
infrastructure projects, with funding from development partners like the World
Bank. In Africa it’s mainly in areas of;
a)
Rural electrification projects(REP)
b)
Road construction/ Highway projects(RCHP)
We can extend fiber closer to the communities
and fast track the 2030 broadband agenda by including overhead fiber runs (in
case of REP) and Utility ducts and fiber (in case of RCHP) within the project
scope as opposed to doing them independently.
|
Rural Electrification Agency(REA) |
Medium Voltage Lines (Km) |
Low Voltage Lines(KM) |
Total(KM) |
Source |
|
|
10,000 |
7,000 |
17000 |
REA Website |
|
Uganda National Roads Authority(UNRA) |
Paved Road(KM) |
Gravel Road(KM) |
|
|
|
|
5,000 |
20,000 |
25000 |
Unverified |
|
|
|
Total |
42,000.00 |
|
Network Opex Vs High Availability
|
Item |
Budget 2021($bn) |
% of 2021 Allocation |
Budget 2030($bn) |
% of 2030 Allocation |
|
Target Broadband Users(millions) |
220 |
1100 |
||
|
Focus Area |
|
|||
|
ICT skills & Dev't |
1.7 |
4.05 |
18 |
17.5 |
|
Policy & Regulation |
0.5 |
1.19 |
2.4 |
2.33 |
|
Network Operations & Maintenance |
2 |
4.76 |
53 |
51.5 |
|
Infrastructure Capex |
5 |
11.90 |
29.5 |
28.67 |
|
Total |
9.2 |
|
102.9 |
|
|
Cost Per Online User connection |
42 |
93.5 |
||
The above
table shows budget allocations as forecast from the World Bank moonlight report
to achieve the broadband milestones. What seems to stand out is the high
operational cost (opex) allocation at 51.5%, perhaps out of the need to run off
diesel generators to power broadband sites, staff salaries and the like.
To
achieve high availability and significant reduction in maintenance costs from
site outages and the like, we argue that an increased investment in the site
Solar power systems and transmission/fiber networks redundancy will go a long
way in achieving this milestone.
By
increasing days of autonomy and number of storage batteries per remote rural site,
and an increased investment in self healing/redundant fibre and/or transmission
network rings at targeted aggregation and access network levels, we
automatically increase site reliability and availability. Several scenarios on
how to achieve both physical/route and logical redundancy are available but
outside scope of this paper.
As well,
as noted previously above, we need to increase fiber footprint closer to
communities, in a range that accommodates high speed, small aperture,
short-haul last mile microwave connections to backhaul traffic to nearest fibre
point of presence and guarantee user end to end broadband speeds as defined by
the moonlight report.
The
budget for this investment can be a reallocation from the current opex budget, a
reduction by say 10% and this reassigned into the Infrastructure capex budget
for the same period. The outlook changes as displayed in the Table Below;
|
Item |
Budget 2021($bn) |
% of 2021 |
Budget 2030($bn) |
% of 2030 |
|
Target Broadband Users(millions) |
220 |
1100 |
||
|
Focus Area |
|
|||
|
ICT skills & Dev't |
1.7 |
18.48 |
18 |
17.49 |
|
Policy & Regulation |
0.5 |
5.43 |
2.4 |
2.33 |
|
Network Operations & Maintenance |
2 |
21.74 |
42.72 |
41.51 |
|
Infrastructure Capex |
5 |
54.35 |
39.78 |
38.67 |
|
Total Budget Forecasts |
9.2 |
|
102.9 |
|
A monthly
bundle of 125 voice minutes of use and 1GB of internet data, including Over the
Top (OTT) Tax(in the case of Uganda), costs about Uganda Shillings 10,000 on
the MTN Uganda network. This represents about 6.8% of Sams’ monthly salary.
This is still higher than the recommended 2% or less by the Broadband
commission in the moonlight report.
In
Madagascar, a monthly voice bundle, with 3hours 45minutes costs 10,000Ariary
and a 2Giga bundle costs 30000 Ariary, a monthly total of 40,000Ariary on the Orange
network. There is no equivalent 1G bundle to compare. These price plans are even
more expensive than in Uganda.
Therefore,
in this digitization agenda, Regulatory bodies need to enforce and industry
players implement special, innovative rural-based broadband price plans with In-bundle rates that attract, and not
deter users in this space. For the same user experience, Sams’ Wife should be
able to pay far less than a normal broadband subscriber in an uptown neighborhood.
Industry
players can implement these specific price plans by using location based
services feature, that tags service and charging plans to a location and is now
available in most core network deployments for 3G and 4G networks of leading
vendors. Also, deployment of such would be similar to say night shift bundles
offered at a cheap in-bundle rate to keep the network active with users online
say after midnight.
But more
importantly, prohibitive regulatory policies, like introduction of Tax on over
the Top Services, like is the case in Uganda, and the recent passing of new
licensing regimes that ideally constrain smaller players in investing
regionally(via exorbitant licence fees etc) makes rural business models commercially
unsustainable in the face of dominant industry market players.


Comments
Post a Comment